Hardware-encoded resource dashboard
amdva-dashboard samples the local AMD APU, draws the approved
dashboard composition on GPU surfaces,
and serves H.264 over RTSP. It needs no browser, desktop session, Qt, model or
inference engine. The HTML remains a synthetic visual prototype; the native
server uses real readings and does not show its DEMO badge.
Build and start
The normal locked bootstrap builds the dashboard by default. Additional font
and DRM packages are installed under .deps, with no system package changes.
python3 scripts/bootstrap.py
source scripts/env.sh
build/examples/resource-dashboard/amdva-dashboard --power-max-w 48
The server listens on all IPv4 interfaces at port 8554, mount /dashboard.
Connect from another PC using rtsp://<server-IP>:8554/dashboard. This sample
provides unauthenticated RTSP; it adds no authentication or TLS layer. For use
on this PC only, pass --bind 127.0.0.1.
For a dashboard-only build after preparing dependencies:
source scripts/env.sh
cmake -S . -B build-dashboard \
  -DAMDVA_BUILD_NVR=OFF -DAMDVA_BUILD_PLUGINS=OFF \
  -DAMDVA_BUILD_STREAMING=OFF -DAMDVA_ROCM_ROOT="$AMDVA_ROCM_ROOT"
cmake --build build-dashboard -j6
build-dashboard/examples/resource-dashboard/amdva-dashboard --power-max-w 48
AMDVA_BUILD_DASHBOARD=OFF omits the sample. The reusable amdva_monitor
library is built and installed independently. The existing runtime still
requires the repository's HIP/libva dependencies; the dashboard performs no
HIP inference and links neither Qt nor MIGraphX.
| Option | Default | Meaning |
|---|---|---|
--bind |
0.0.0.0 |
Listener address |
--port |
8554 |
RTSP port, 1–65535 |
--mount |
/dashboard |
Absolute RTSP mount path |
--render-node |
/dev/dri/renderD128 |
AMD DRM render device used for measurement, GL and VA |
--fps |
10 |
Integer output frame rate, 1–60 |
--bitrate-kbps |
4000 |
Encoder target bitrate in kbps |
--power-max-w |
48 |
Positive finite Power bar scale in watts |
--font |
automatic | Font file; local locked DejaVu Sans Bold is preferred when AMDVA_ROOT is set, then Fontconfig |
--duration-seconds |
unlimited | Optional timed shutdown, useful for tests |
--cpu-name, --gpu-name |
detected | Text shown instead of the CPU name from /proc/cpuinfo and the GPU marketing name from libdrm; printable ASCII, up to 120 characters |
Resolution is 1920 × 1080, progressive, NV12, BT.709 limited range. H.264 has
no B frames and a one-second maximum keyframe interval. Audio is absent.
Invalid command-line values are rejected. --help requires no GPU initialization.
The Power scale changes only the visualization; it does not alter a machine
power limit. Real readings above the scale remain visible, with the bar saturated.
Receiving and NVR integration
Add a camera in the NVR's Cameras page with URL
rtsp://127.0.0.1:8554/dashboard when both run on this PC. Select it in Live.
It records like other registered sources and is available in Recordings
for hardware playback. Selected channels also follow the NVR's configured AI
policy, even though the dashboard itself has no AI dependency.
To inspect the stream independently, for example with FFmpeg installed:
ffplay -rtsp_transport tcp rtsp://127.0.0.1:8554/dashboard
ffmpeg -rtsp_transport tcp -i rtsp://127.0.0.1:8554/dashboard \
  -t 30 -c copy dashboard.mkv
Multiple RTSP clients share the same encoder and resource history. When the last client disconnects, frame generation stops; measurement continues and a new client can start a fresh media session. Appsrc, raw-frame queue and VA pool are bounded. Saturation skips rendering work rather than retaining an unlimited frame backlog. PTS/DTS are based on each media session's monotonic clock; missed frame intervals are not emitted in a catch-up burst.
GPU surface path
/proc + amdgpu sysfs -> ResourceMonitor -> bounded history / drawing geometry
                                                    |
                         EGL/GLES FBO -> shared BGRA VA surface
                                                    |
                              VA VideoProc -> NV12 VAMemory pool
                                                    |
                         appsrc -> vah264enc -> h264parse -> RTP -> RTSP
The EGL device is selected by the same DRM render node as VA. A writable DMA-BUF export is imported as a framebuffer attachment. GL fences complete the draw before VA conversion; VA synchronization completes NV12 writes before encoder submission. Buffer ownership prevents pool reuse while the encoder retains a frame. The encoder sink verifies the submitted VA surface identities and shared display. A bounded SPS rewrite on the compressed encoder output explicitly signals BT.709 primaries, transfer, matrix and limited range, because the locked VA encoder does not emit those VUI fields from input caps alone. Slice data and timing are preserved; this is compressed-header processing, not a raw-image transfer.
No frame image is mapped, downloaded or uploaded on the CPU. Font glyphs are rasterized and uploaded once at startup; ongoing CPU uploads are geometry, not video pixels. Encoded bitstream buffers are handled on the CPU for RTP/network transmission. This is a GPU-resident raw-image path, not a claim that compressed network data never touches the CPU. Software rendering and software encoding fallbacks are not provided; required EGL/VA failures stop the server.
On the validated Radeon 890M / Mesa 25.2.8, VPE rejects NV12 as an output format. VA VideoProc performs this RGB-to-NV12 operation through the GPU compositor instead. This still avoids CPU pixel transfers. It differs from the NVR's supported NV12-to-BGRA VPE scaling direction. VPE utilization can therefore remain unavailable when no other observable VPE client exists.
Mesa 25.2.8 also defers equal-region format conversion to its encoder after the first 16 frames, causing VA processing failure and potentially retaining a mutable RGB source. The renderer uses a 1920 × 1082 BGRA allocation, draws into rows 2–1081, and explicitly converts that rectangle into 1920 × 1080 NV12 at origin zero. Differing source/destination origins avoid that EFC shortcut, without cropping dashboard content or adding a CPU copy. Relevant Mesa sources: postprocessing, picture submission.
Measurement contract
The Qt-free public header amdva/resource_monitor.hpp exposes ResourceMonitor,
ResourceMonitorConfig and ResourceSample. sample() is a synchronous,
single-caller API with monotonic nanoseconds and wall-clock milliseconds.
Every metric is optional: absent means unsupported, inaccessible, invalid or
not yet measurable. Read-time procfs failures during process exit are treated
as missing data rather than terminating the monitor. This is separate from
video latency telemetry.
Sampling normally runs every 100 ms; history retains at most 601 samples and 60 seconds. Hardware SMU averages may have approximately one-second filtering. No fictitious history is generated at startup. Missing data or long sample gaps interrupt graph lines and their fill. Device names are detected at startup; calendar time uses the host's local timezone.
| Reading | Source and interpretation |
|---|---|
| CPU | /proc/stat deltas, 0–100% for the whole system; first sample is absent |
| GPU | Optional device-counter wave presence; gpu_busy_percent when no valid wave sample is available |
| VCN | Preferred: busiest encode/decode engine class (enc, dec, enc_1) from readable DRM client busy-time deltas; vcn_busy_percent fallback when no paired DRM counters are available |
| Host memory | /proc/meminfo total and total minus available |
| VRAM reservation / used | mem_info_vram_total / mem_info_vram_used |
| GTT used / limit | mem_info_gtt_used / mem_info_gtt_total |
| DRAM read / write | Validated little-endian gpu_metrics v3.0 read/write bandwidth, converted from MB/s to decimal GB/s |
| Socket power | Same v3.0 blob, mW converted to W |
| VPE | Busy-time deltas over readable /proc/PID/fdinfo clients on the selected PCI device, deduplicated by device/client ID and normalized for engine capacity |
The v3.0 parser verifies revision, declared size and available bytes, and treats
unavailable sentinels as absent. Other revisions do not produce invented values;
independent sysfs readings continue. No root access or system tuning is needed.
DRM-based VCN and VPE cover readable clients, not a guarantee of global coverage.
Each class is normalized by its reported engine capacity (default one); aliases
are deduplicated by PCI device, client ID and engine class, while independent
clients on the selected device are added. The single VCN value is the maximum
of these class percentages, not their sum: separate encode/decode engines can
run concurrently. JPEG is not included. This is a busy-time estimate, not a
percentage of peak codec throughput. On VCN4 the unified encode/decode queue
is accounted under enc, including NVR decoding.
On the validated Radeon 890M, vcn_busy_percent remains zero during active
hardware encoding and decoding, while DRM counters advance. Therefore paired
DRM readings take precedence, including measured zero. First observations,
missing counters and regressions have no DRM delta; VCN then falls back to
valid sysfs data, and VPE remains unavailable. Regressions retain the high
watermark until the counter catches up; exited clients are discarded. See the
kernel DRM statistics contract,
amdgpu engine names
and VCN4 unified queue implementation.
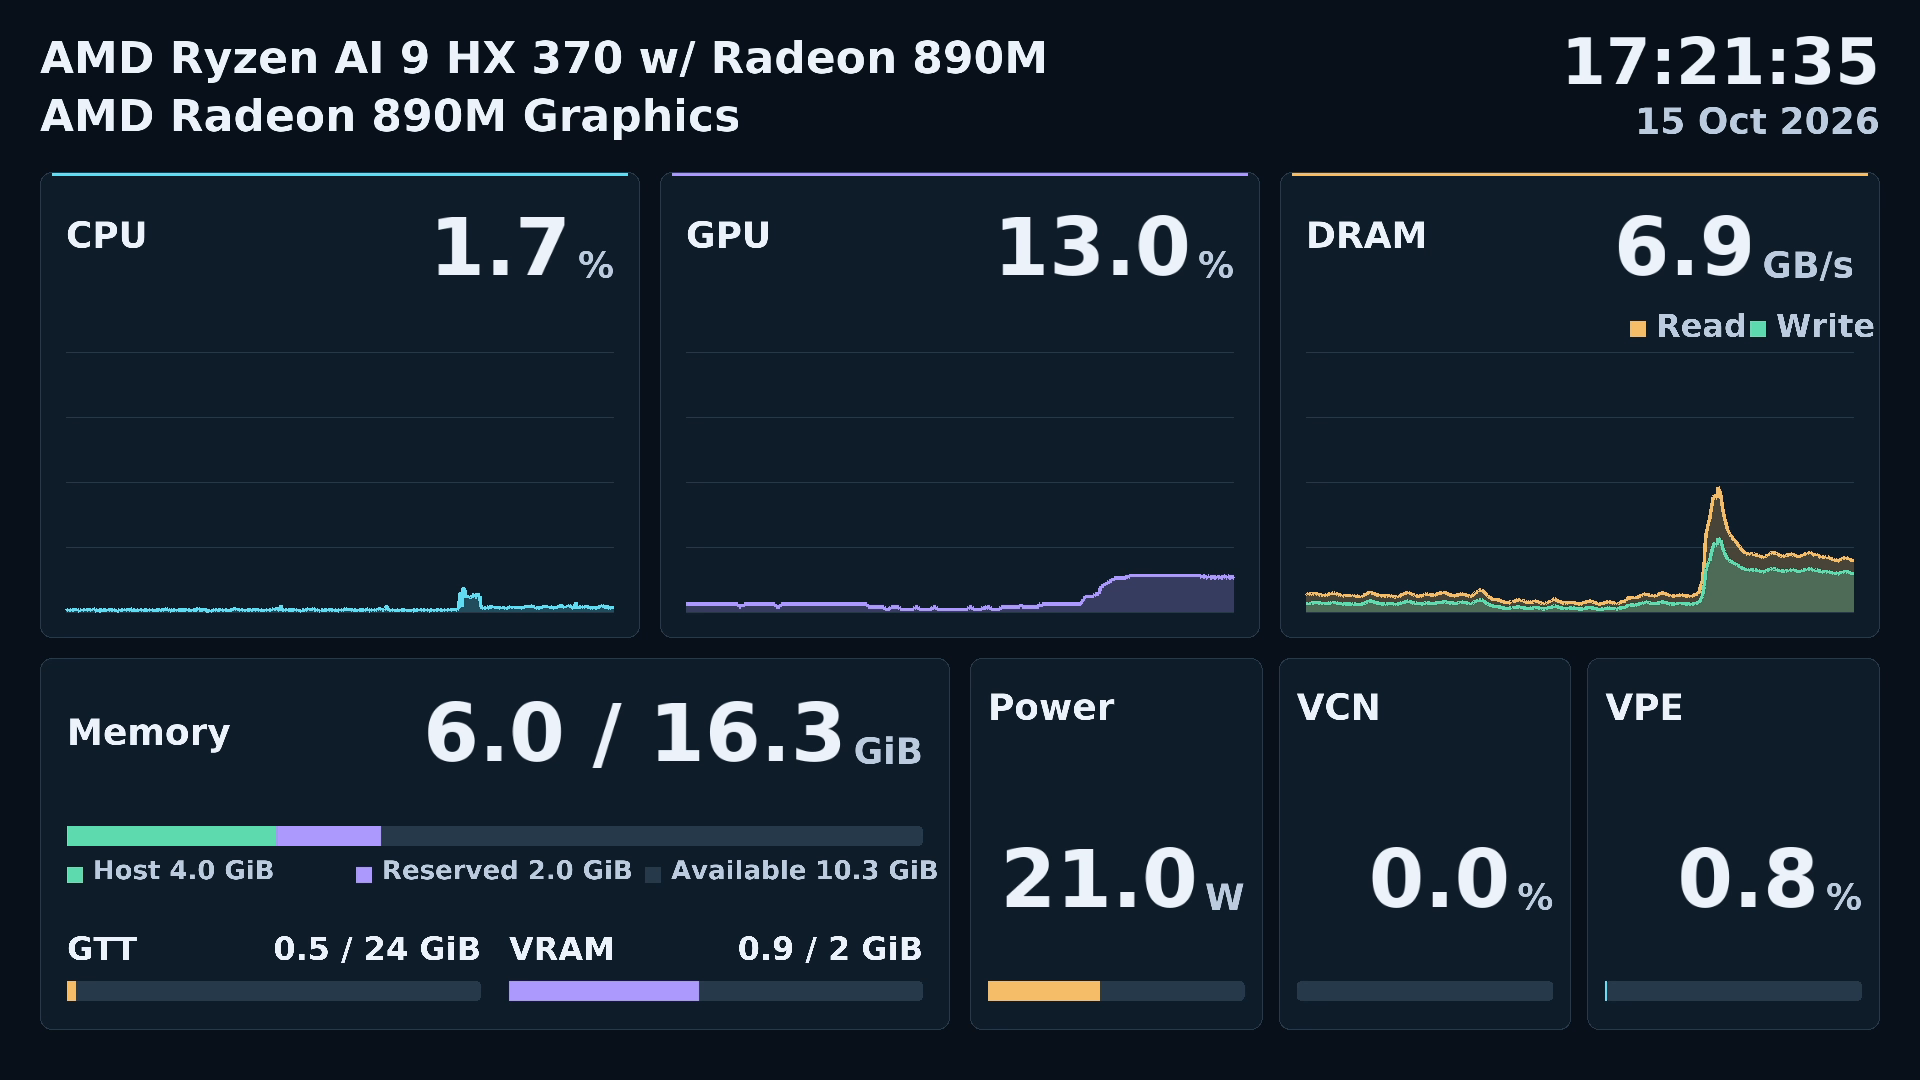
Memory is binary GiB. The main total is Host capacity plus dedicated VRAM
reservation, and its numerator is Host used plus that complete reservation.
GTT is neither added again nor subtracted from Host. Separate lower bars show
GTT against its own limit and VRAM used against its reservation. This describes
managed regions rather than all physically installed RAM. For example, the
validation PC has mem=16G; the displayed detected capacity is approximately
16.3 GiB including its 2 GiB reservation, not the HTML fixture's 32 GiB. The boot
setting is not modified. See the prototype definitions
for the shared accounting rationale and original reference repository.
Optional wave-presence collection
AMDVA_GPU_WAVE_MODE=continuous requests the separate amdva-wave-sampler
process; window collects for 500 ms and pauses for 500 ms. sysfs disables it.
The default remains sysfs: the clock-normalized candidate did not reproduce
wall-time duty under varying clocks (see the acceptance results below). For example, run AMDVA_GPU_WAVE_MODE=window build/examples/resource-dashboard/amdva-dashboard
after sourcing scripts/env.sh. The helper
is built when the host ROCprofiler-SDK headers and library are available
(AMDVA_BUILD_WAVE_SAMPLER=OFF omits it). Only Ubuntu 26.04 / gfx1151 is admitted;
other configurations continue using sysfs without changing the GPU label.
The candidate is 100 * mean(SQ_BUSY_CYCLES) / GRBM_COUNT over one collection
window. Region count comes from the SDK, not a fixed GPU-specific constant.
It counts cycles with resident waves, including memory stalls; it is neither
ALU issue utilization nor a measure of remaining processing capacity. Clock
normalization and power gating are part of the hardware acceptance check.
ResourceMonitorConfig::wave_sample_path optionally selects an atomic sample
file. The monitor itself starts no thread or process. Files carry PCI identity,
boot identity, monotonic completion time and raw counters. Samples older than
three seconds, mismatched identities, zero denominators, incomplete data and
out-of-range counters use sysfs immediately. The original gpu_pct field and
screen label are retained. ResourceSample::gpu_source and gpu_status, also
included in dashboard status logs, expose diagnostics without changing the UI.
The dashboard manages its helper in /run/user/UID/amdva-wave, with a per-GPU
lock and a private directory. SDK initialization failure, missing binaries and
helper termination leave rendering operational with the conventional reading.
The helper never injects profiling into the NVR or changes hardware queue limits.
Validation
VCN counter regression (2026-10-15): while the existing dashboard encoder and
NVR decoder were active, sysfs reported 0% but the corrected monitor measured
8.7–9.1% over five one-second intervals. An isolated 20-second headless server
on port 8596 with a 12-second RTSP recording reported 13.6–13.8% during its
additional encode workload, 124 submitted frames, zero skipped frames and zero
copy-audit errors. The recording contained 121 H.264 1920×1080 BT.709 limited
frames. All eight dashboard-only CTest contracts passed, including new VCN
counter, capacity, alias, multi-client, PCI filter, idle, fallback, regression
and malformed-input cases. Local artifacts: artifacts/dashboard-vcn-live.log
and artifacts/dashboard-vcn-rtsp/. These observations demonstrate busy-time
reporting under this workload; they do not calibrate peak codec throughput.
Run the real RTSP scenarios after building, using an unused output directory:
source scripts/env.sh
python3 examples/resource-dashboard/validate.py --seconds 600 --output artifacts/dashboard-check
The tool starts the server without DISPLAY/Wayland, enables copy/GL-image auditing, receives simultaneous clients, exercises all-client disconnect and reconnect, kills a second client abruptly, and verifies recorded H.264 files. It captures a decoded diagnostic image in the receiving process only. After a 240-second warmup, existing 64 MiB RSS/GPU and 44-FD growth guards apply. FPS and resource usage are observations, not an operational performance rating.
resource-monitor-contract covers metric ABI/units/sentinels, missing data,
CPU deltas, memory capacities, duplicate DRM FDs, first samples and client/counter
lifecycle. CLI tests exercise help and invalid settings. The SPS contract checks color
signaling, preserved geometry/timing, unchanged non-SPS NALs and malformed data. The copy-audit contract
also checks opt-in GL readback detection. Existing NVR diagnostic captures keep
GL auditing disabled; the dashboard enables it after the startup font upload.
When NVR is built, amdva-dashboard-nvr-validate CONFIG.json is a manual test
helper for a single selected dashboard source. It verifies live decoding,
rendering and AI, catalog recording and hardware playback. Use a separate config
and recording root with five-second segments. The installed production server
does not depend on this helper or Qt.
Wave-counter acceptance on Ubuntu 26.04 / gfx1151
The 2026-11-12 record contains 24 micro trials, four external-sampler GUI trials and eight integrated GUI trials (continuous and window cohorts). Each GUI trial ran at least 60 seconds; aggregates exclude the first 20 seconds. The saved selection displays 15 videos plus the dashboard and records all 16 videos plus the dashboard; cam15 is not decoded or analyzed. The following changes compare each cohort with its own off baseline.
| Metric | External continuous | Integrated continuous | Integrated window |
|---|---|---|---|
| Display FPS | +0.09% | -0.24% | +0.18% |
| Effective AI Hz | +0.12% | -1.32% | -1.30% |
| YOLO inference P95 | +0.53% | +6.71% | -2.31% |
| ReID inference + transfer P95 | -3.02% | +10.30% | -0.15% |
The external sampler passed the observed performance thresholds. The integrated continuous sampler exceeded the 5% P95 allowance for YOLO inference and ReID inference plus transfer. The window cohort met the observed performance thresholds (maximum stage P95 increase 3.30%; effective AI frequency decreased 1.30%). These small cohorts include baseline variation; differences are observations, not a causal estimate or proof of zero profiler overhead. P95 entries summarize rolling application snapshots, not a pooled percentile.
Automatic adoption remains disabled. A timed pulsed workload had 25.41% active wall time while the candidate averaged 23.13% over matched sample intervals. Launch/synchronization time is included in the timed workload, so this does not directly measure WGP wall-time occupancy; it leaves the normalization unverified. With one stream and idle gaps, GRBM_COUNT was zero despite intermittent work. The candidate is therefore exposed for explicit diagnostic use as a cycle-based wave-presence ratio, with sysfs fallback, rather than enabled by default.
Empty streams measured zero wave presence, FMA approximately 98.7%, and a
dependent-memory-load workload approximately 96.7%. Helper duplication,
termination, missing binary and SDK initialization failure were exercised.
Recording catalogs and codec metadata were checked for all 17 sources in every
GUI trial; copy-audit violations were zero. All 30 contract tests passed.
Raw logs, scripts and recordings remain under
/home/amd/work/rai/logs/gpu-counter-overhead-20261112.
Recorded results
The validation record identifies the implementation revision, frozen-runtime differences, hashes and local artifacts. All 23 CTest cases passed. A 600-second headless run passed shared clients, all-client disconnect/idle/reconnect and abrupt-client disconnect; all three recordings were valid 1080p H.264 at 10fps. After warmup, maximum growth was 68 KiB RSS, zero GPU allocation and three FDs, within existing guards. There were no copy-audit violations.
The final implementation passed a separate 110-second RTSP regression and
30fps/65W LAN-listener test. The latter recorded 1,501 frames over 50 seconds
with BT.709 primaries/transfer/matrix and limited range. NVR live rendering, AI,
recording search and hardware playback passed; all NVR fragments finalized and
passed media inspection. Active-client timed server shutdown completed without
GStreamer criticals. A dashboard-only build linked neither Qt nor MIGraphX, and
an installed CMake SDK client used AMDVA::amdva_monitor successfully.
The DRAM history is stacked: amber Read starts at zero and green Write sits above it. The top edge shows Read + Write, matching the numeric GB/s value. Its vertical scale follows the combined peak over the displayed history (20 GB/s increments, minimum 20 GB/s). Missing read or write samples leave a gap in both areas.