Resource dashboard: visual prototype
Open index.html directly in a browser. No server, installation, network connection or hardware access is required. All readings, hardware names and historical samples are synthetic.
xdg-open examples/resource-dashboard/index.html
The dark 1920 × 1080 composition scales as a whole in narrower windows. Open
index.html?video=1 for the video area alone; DEMO DATA remains visible.
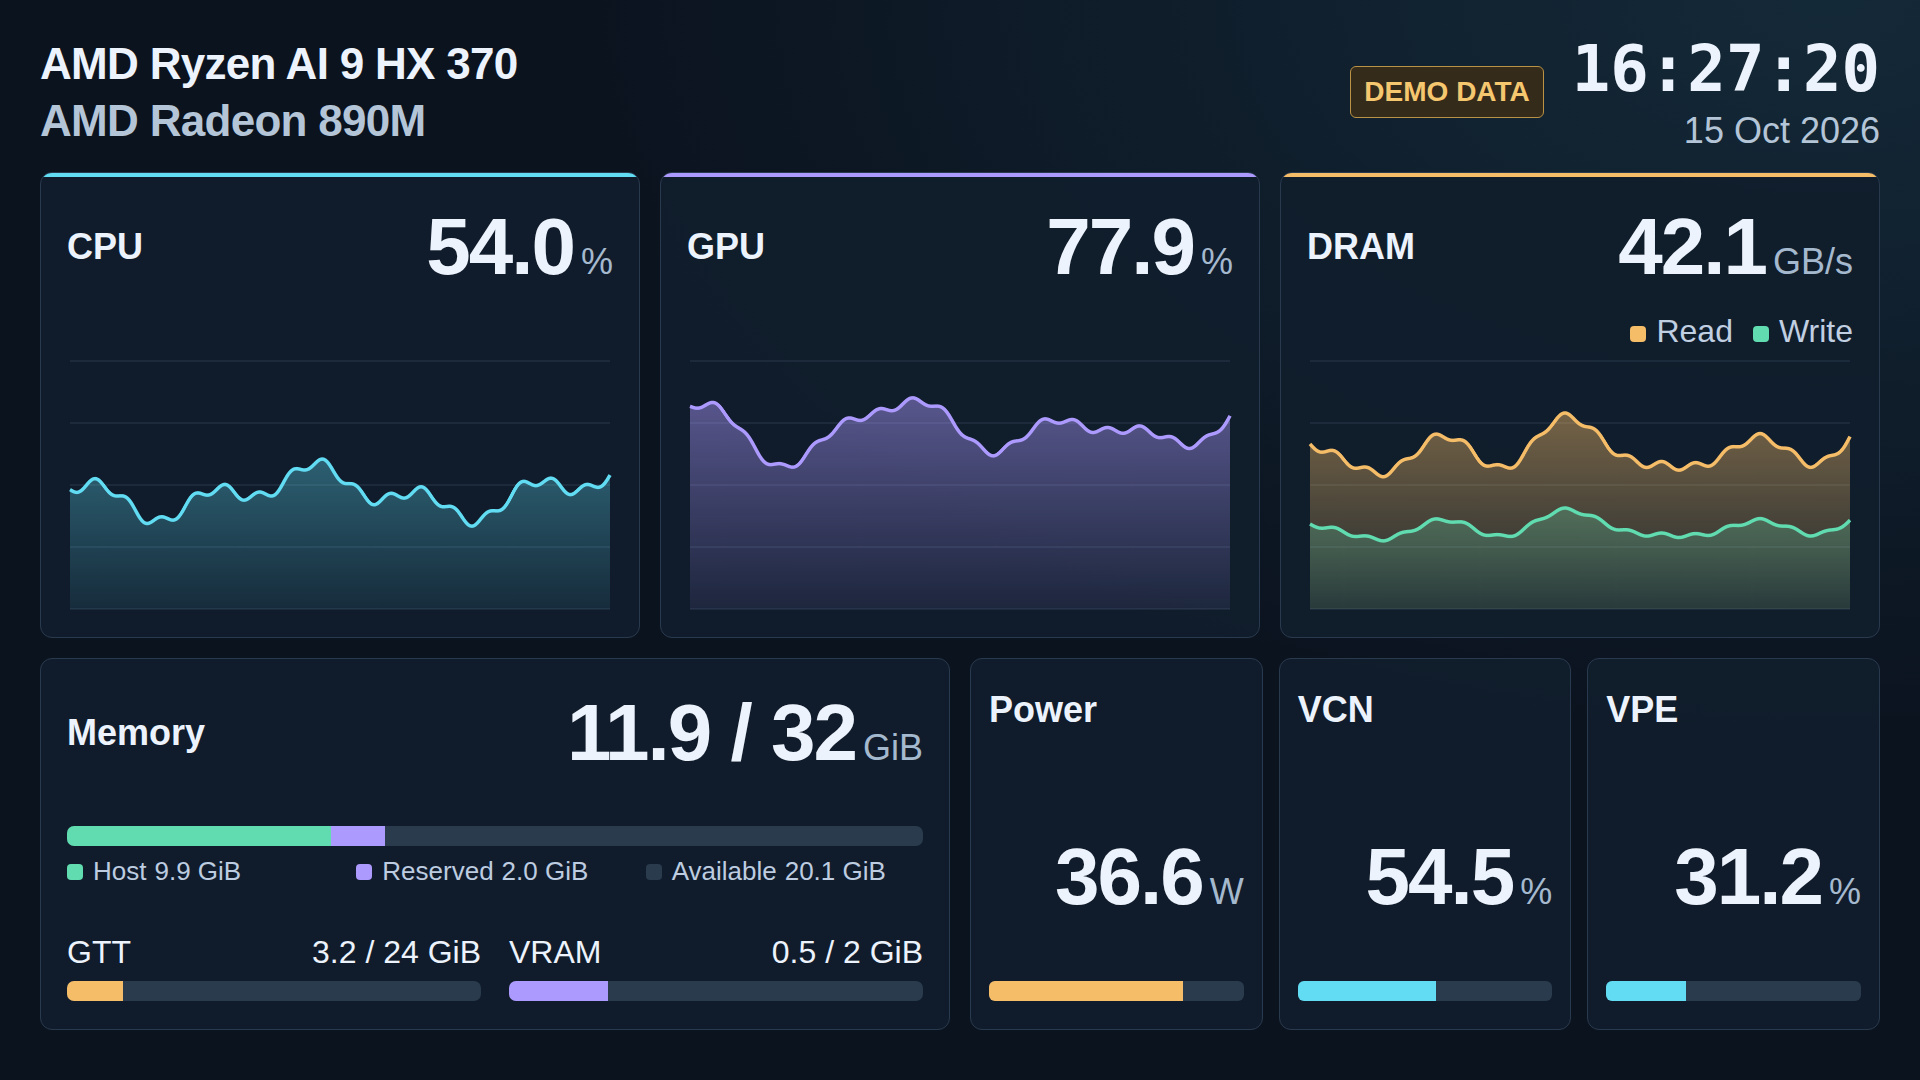
This mode does not produce a video stream. Each CPU/GPU/DRAM panel combines its current reading and filled graph.
Memory occupies half of the lower row; Power, VCN and VPE share the other half.
The CPU/GPU names, date, readings and graphs are sized for smaller NVR tiles. Axis labels, explanatory
notes, clock frequencies, per-process readings and separate APU/GFX power are omitted.
Use the controls outside the video area to select Idle, CPU load, GPU load or Mixed load, pause/resume, and simulate missing GPU metrics. Scenario changes affect new samples and retain preceding history. Pause freezes collection and the sample clock; resume continues the simulated timeline. Missing-metric changes take effect at the next sample or after resuming.
The preview starts with 60 seconds of generated history and updates every
100 ms. History is bounded to 601 samples and a 60-second window. Missing,
non-finite or absent readings display N/A; unavailable bars are striped.
Neither lines nor fills cross missing samples or large time gaps. CPU/GPU
scales remain 0–100%. DRAM read/write use a common data-driven scale in decimal
GB/s; the headline is their sum. No theoretical-bandwidth percentage is assumed.
The date and time follow sample timestamps in the browser's local timezone.
Startup power limit
The default Power bar scale is 48 W. Pass powerMaxW in the URL to set a
positive, finite upper limit in watts, for example index.html?powerMaxW=48
or index.html?video=1&powerMaxW=65. The video-only link preserves the setting.
The controls show the selected scale. Missing settings use 48 W; invalid,
zero or negative settings fall back to 48 W with a note beside the controls.
The bar represents current socket power / configured upper limit. Readings
above the configured limit remain visible; only the bar saturates at 100%.
Missing/invalid readings display N/A with a striped bar. This setting is a
visualization scale, not a detected hardware limit or a command to change the
machine's power limit. snapshot().config.powerMaxW reports the active setting.
The HTML still uses synthetic power readings.
Memory accounting
The fixture models 32 GiB, divided into 30 GiB of Host capacity and 2 GiB reserved for the iGPU. It distinguishes the reserved capacity from the amount actually used within that reservation. All memory values use binary GiB.
Host, Reserved and Available each include the GiB unit in their readings.
The main bar has a capacity of hostTotalGiB + vramReservedGiB and shows:
- Host:
hostUsedGiB, including GTT-backed pages accounted by the OS. - Reserved: the complete
vramReservedGiBreservation, even when partly idle. - Available:
hostTotalGiB − hostUsedGiB.
The headline reports Host used + VRAM reserved, relative to that capacity.
It measures unavailable/allocated capacity, not application-resident bytes.
The main segments never include GTT as an additional allocation. Two independent
lower bars show GTT allocation / GTT allocation limit and VRAM used / VRAM reserved.
GTT is not subtracted from Host; its accounting does not define an exact,
independent physical pool. These bars must not be added to the main bar.
The GTT fixture uses a 24 GiB allocation limit, independent of the 30 GiB Host
capacity. GTT is displayed as used / limit, with the bar normalized to that
limit. Missing, zero or invalid limits make the GTT reading unavailable; Host
capacity is never substituted. The inspected development PC reports 24 GiB
from mem_info_gtt_total, but live collection must detect this value.
If a required input is unavailable or inconsistent, the affected bar is striped
and its reading is N/A, rather than treating the value as zero. Known Host
values and independent bars remain readable. An unavailable VRAM reservation
makes the main total unavailable. Negative quantities and usage above the
corresponding capacity are invalid.
A future collector must use detected OS capacity and GPU reservation, not the
32 GiB fixture. Their sum represents the managed regions, not necessarily all
physically installed RAM. Firmware reservations and boot-time memory limits
can exclude additional memory. On the development PC checked during planning,
mem=16G was in the boot arguments, Linux reported about 14.27 GiB, and VRAM
reservation was 2 GiB. Those settings are unchanged; the fixture is not a
measurement or a claim that 32 GiB is currently OS-accessible.
Metric sources for a future collector
Metric selection follows the reference repository's resource-utilization notes and monitor implementation. These sources are documented here; this version does not collect them.
| Display | Intended source / meaning |
|---|---|
| CPU | /proc/stat deltas; whole-system utilization, 0–100% |
| GPU | amdgpu gpu_busy_percent; device-wide |
| Host used / capacity | /proc/meminfo, MemTotal − MemAvailable / MemTotal |
| VRAM reservation / used | amdgpu mem_info_vram_total / mem_info_vram_used |
| GTT allocation / limit | amdgpu mem_info_gtt_used / mem_info_gtt_total; the limit is not installed RAM |
| DRAM read / write | gpu_metrics v3.0 dram_reads / dram_writes, MB/s converted to GB/s; SoC-wide, CPU and GPU combined |
| Power | gpu_metrics v3.0 socket power, mW converted to W |
| VCN | vcn_busy_percent; codec-engine utilization where supported |
| VPE | drm-engine-vpe busy-time differences for observable DRM clients, divided by elapsed time and engine capacity |
See the kernel documentation for memory reporting and DRM usage statistics. GPU metrics can be SMU-filtered, approximately one second, despite 100 ms sampling. Missing/unsupported metrics must remain unavailable. The reference machine's 256 GB/s theoretical DRAM bandwidth is not a default for other APUs.
VCN is the name exposed by this system for the codec block (sometimes described
as VCU). VPE has no equivalent global vpe_busy_percent on the inspected PC.
Its future collector must deduplicate clients by device and drm-client-id,
use consecutive observations and account for exported engine capacity. A first
sample, inaccessible counters or unsupported hardware must produce N/A.
Client appearance, exit and counter resets need explicit handling. The result
covers observable clients, not necessarily the whole system; no selected NVR
PID is required. VPE in this HTML is only a synthetic design example.
Data boundary and next stage
window.ResourceDashboard.ingest(sample) accepts a copied sample and renders
it; snapshot() returns the latest sample and history count. Pause the demo
before manual injection. Timestamps are epoch milliseconds and must increase
strictly; invalid/out-of-order timestamps are rejected. There is no live
collector integration. The sample fields are:
{
  timestampMs,
  cpuPct, gpuPct, dramReadGBs, dramWriteGBs,
  hostUsedGiB, hostTotalGiB, vramReservedGiB, vramGiB, gttGiB, gttTotalGiB,
  socketW, vcnPct, vpePct
}
vramGiB continues to mean VRAM used; vramReservedGiB is its capacity.
Clock, individual APU/GFX power and process fields from the initial prototype
are removed. Machine names remain HTML fixtures to replace with discovered
metadata in a real collector. Sources must supply null for missing values.
The native RTSP sample implements real collection, headless GPU drawing and hardware H.264 encoding. This HTML defines the composition; it does not mandate browser capture as the video source. The native path uses GPU-rendered shared surfaces and GPU color conversion without CPU pixel readback, serving encoded output over RTSP. The HTML itself adds no encoder, RTSP server or changes to the existing NVR application.
Prototype validation
Checked in Chromium using local file:// loading: all four scenarios,
pause/resume, GPU metric loss/recovery including VCN/VPE and memory, and 125
seconds of accelerated updates with bounded history. Sample-injection checks
verified that GTT and VRAM usage changes do not inflate the main total, that
reserved capacity remains distinct from usage, and that detected capacities,
invalid values and partial data are handled. Canvas pixel checks verified fill
below valid data and no fill across missing samples.
The composition fits without panel clipping at 1080p and scales without
horizontal overflow at 1920, 960, 480 and 320 pixels wide. At 480 pixels, main
readings, hardware names and graph trends remain identifiable; memory detail
labels are secondary. No browser errors or external network requests occurred.
The local validation record is artifacts/resource-dashboard/validation-revised.json.